Technical Analysisby Akhil Gaddam
Technical Analysis Strategies for Cryptocurrency Traders: Master the Charts
2 min read28 January 202639 reads
Written by

1 follower
The Power of Technical Analysis in Crypto Trading
Technical analysis is the art of reading price charts to predict future market movements. Unlike fundamental analysis which focuses on intrinsic value, technical analysis relies on historical price and volume data. In the volatile cryptocurrency market, mastering technical analysis can significantly improve your trading results.
Candlestick Patterns: Reading the Market
Candlestick patterns form the foundation of technical analysis. Each candle represents a specific time period (1-minute, hourly, daily, etc.) and shows the open, close, high, and low prices. Key patterns include:
- Bullish Engulfing: A larger green candle completely engulfs the previous smaller red candle, indicating strong buying pressure
- Bearish Engulfing: The opposite pattern suggesting selling pressure
- Hammer and Hanging Man: Patterns indicating potential reversals
- Morning Star and Evening Star: Complex three-candle patterns predicting trend changes
Support and Resistance Levels
Support levels are price points where buying pressure prevents further decline, while resistance levels are points where selling pressure prevents further increases. Identifying these levels is crucial for:
- Setting stop-loss orders
- Determining entry and exit points
- Understanding market structure
- Predicting potential price targets
Moving Averages: Smoothing the Noise
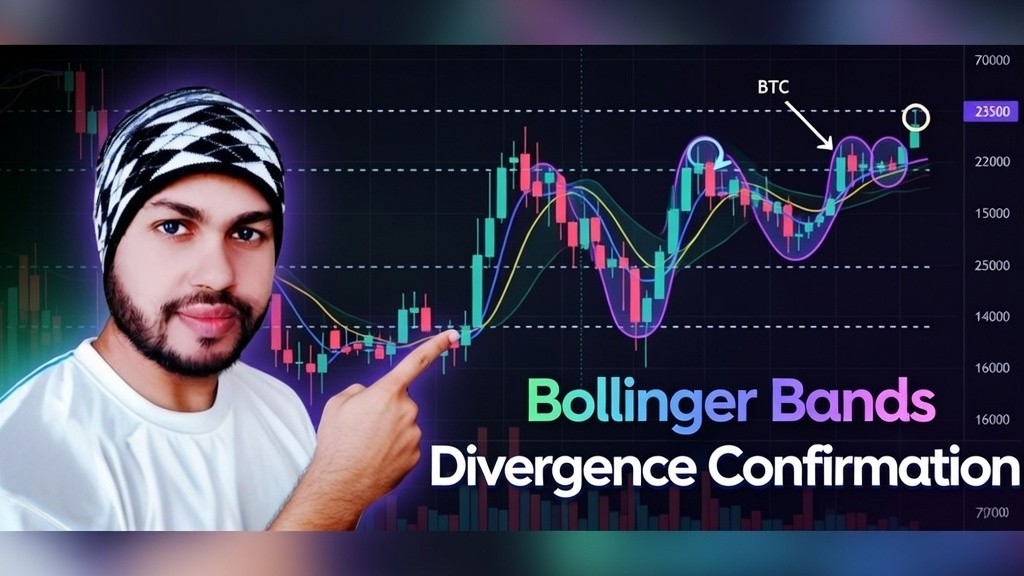
Moving averages smooth out price data to identify trends. The Simple Moving Average (SMA) and Exponential Moving Average (EMA) are most popular. Traders use crossovers of different moving averages as trading signals.
Oscillators: Measuring Momentum
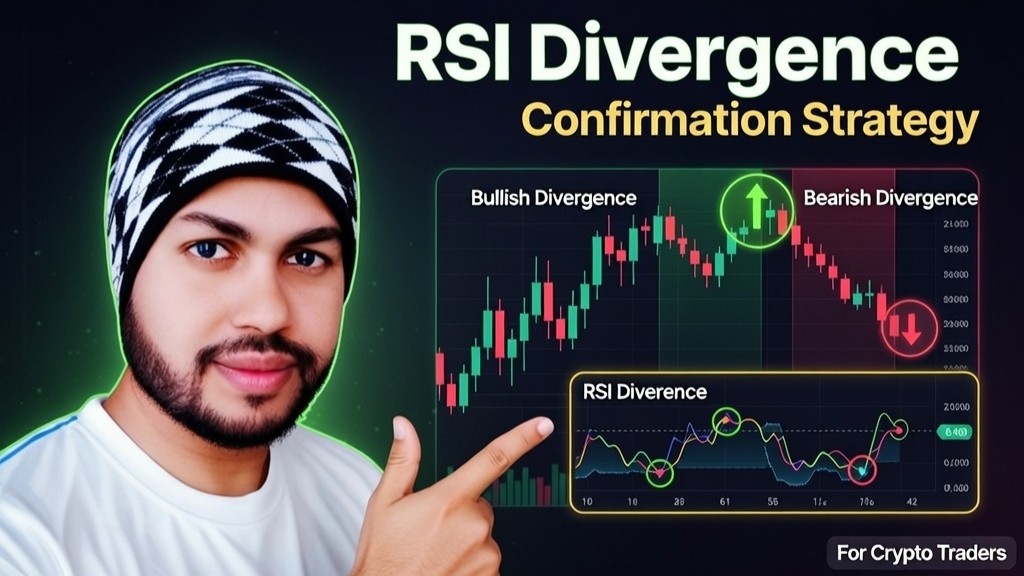
The Relative Strength Index (RSI) measures momentum, indicating whether an asset is overbought (above 70) or oversold (below 30). The MACD indicator shows the relationship between two moving averages and helps identify trend changes and momentum shifts.
Volume Analysis
Volume confirms price movements. High volume during price increases suggests strong buying, while high volume during declines indicates selling pressure. Low volume price movements are often unreliable.
Combining Multiple Indicators
Successful traders don't rely on single indicators. Instead, they use multiple tools to confirm signals:
- Use moving averages to identify the trend
- Use RSI to confirm overbought/oversold conditions
- Use volume to confirm the strength of the move
- Look for candlestick pattern confirmation
Conclusion
Technical analysis provides a systematic framework for trading decisions. Practice with historical charts, backtest strategies, and paper trade before risking real capital. Remember that no indicator is 100% accurate, and combining multiple tools significantly improves trading success rates.