RSIby AiBlock
RSI Divergence Confirmation: A Practical Guide for Crypto Traders
3 min read9 January 202662 reads
Written by

1 follower
🟠Helping creators get monetised 💯% free. Roasting all #shitposters & bad actors. Crypto enthusiast
RSI Divergence Confirmation: A Practical Guide for Crypto Traders
What is RSI?
The Relative Strength Index (RSI) is a momentum oscillator that measures the speed and strength of price movements on a 0–100 scale.
Standard setting: 14-period
Key levels:
- Above 70 → Overbought (potential reversal or pullback)
- Below 30 → Oversold (potential bounce or reversal)
- Above 50 → Bullish momentum
- Below 50 → Bearish momentum
RSI reacts faster than moving averages and excels at spotting momentum shifts.
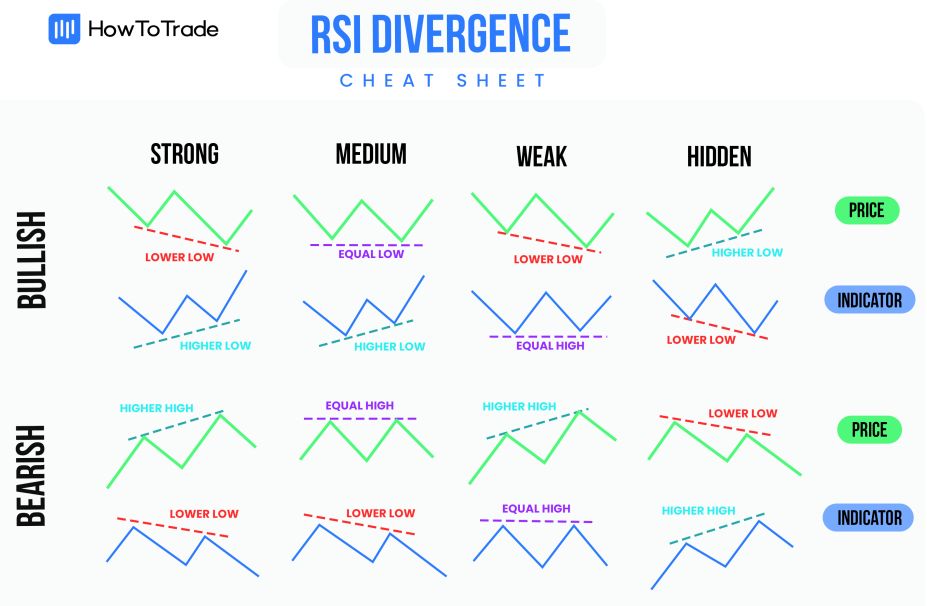
What is Divergence?
Divergence occurs when price and RSI move in opposite directions → this signals weakening trend momentum and often precedes reversals.
Two main types:
Regular Divergence (reversal signal)
- Bullish: Price makes lower low → RSI makes higher low
- Bearish: Price makes higher high → RSI makes lower high
Hidden Divergence (continuation signal)
- Bullish hidden: Price higher low → RSI lower low (uptrend continuation)
- Bearish hidden: Price lower high → RSI higher high (downtrend continuation)
Focus primarily on regular divergence for high-probability reversal confirmation.

Core Idea for Confirmation
Use RSI divergence to confirm entries in the 9–15 EMA strategy:
- In an uptrend (9 EMA > 15 EMA), bullish divergence on pullbacks strengthens long setups
- In a downtrend (9 EMA < 15 EMA), bearish divergence on rallies strengthens short setups
Divergence alone is not enough — always require price action confirmation (EMA respect, candlestick close, or breakout).
Bullish Divergence Confirmation
Higher Timeframe Bias (4H)
- Price making clear lower lows
- RSI forming higher lows (ideally starting from below 30–40)
- Occurs near key support or in oversold conditions
Trend Confirmation (1H)
- 9 EMA still above 15 EMA (or close to crossing up).
- Price respecting 9–15 EMA zone as support
- Bullish divergence visible on RSI
Entry Setup (15m or 1H)
- Wait for price to hold the 9–15 EMA zone.
- Confirm bullish candlestick (pinbar, engulfing) or close above recent swing high
- RSI crosses above 50 or breaks its own downtrend line
- Enter long on confirmation candle close
SL/TP
- SL: Below recent swing low or on close below 15 EMA
- TP: Minimum 1:2 RR | trail SL below new swing lows
Bearish Divergence Confirmation
Higher Timeframe Bias (4H)
- Price making clear higher highs
- RSI forming lower highs (ideally from above 60–70)
- Occurs near key resistance or in overbought conditions
Trend Confirmation (1H)
- 9 EMA still below 15 EMA (or close to crossing down).
- Price respecting 9–15 EMA zone as resistance
- Bearish divergence visible on RSI
Entry Setup (15m or 1H)
- Wait for price to reject the 9–15 EMA zone.
- Confirm bearish candlestick or close below recent swing low
- RSI crosses below 50 or breaks its own uptrend line
- Enter short on confirmation candle close
SL/TP
- SL: Above recent swing high or on close above 15 EMA
- TP: Minimum 1:2 RR | trail SL above new swing highs

Conditions to Avoid
- No clear swing highs/lows to draw divergence lines
- Divergence in very strong trending markets (can persist longer than expected)
- Multiple small divergences without higher-timeframe alignment
- Choppy/range-bound price with frequent false signals
- Ignoring volume or overall market structure
Additional Tips
- Best on 1H–4H charts for crypto (lower timeframes produce more noise)
- Combine with 9–15 EMA trend bias for higher win rate
- Wait for confirmation — never enter on divergence alone.
- Works well on BTC, ETH, and major altcoins
RSI divergence is one of the strongest confirmation tools when paired with the 9–15 EMA strategy — it helps filter weak pullbacks and catch high-probability reversals or continuations.