MACDby AiBlock
MACD Divergence Confirmation: A Practical Guide for Crypto Traders
3 min read9 January 202674 reads
Written by

1 follower
🟠Helping creators get monetised 💯% free. Roasting all #shitposters & bad actors. Crypto enthusiast
MACD Divergence Confirmation: A Practical Guide for Crypto Traders
What is MACD?
The Moving Average Convergence Divergence (MACD) is a momentum indicator that shows the relationship between two exponential moving averages of price.
Standard settings: 12-period EMA, 26-period EMA, 9-period signal line
Components:
- MACD line → 12 EMA – 26 EMA (fast momentum)
- Signal line → 9-period EMA of the MACD line
- Histogram → MACD line – Signal line (visual momentum strength)
MACD identifies trend changes through crossovers, zero-line crosses, and divergences.

What is Divergence?
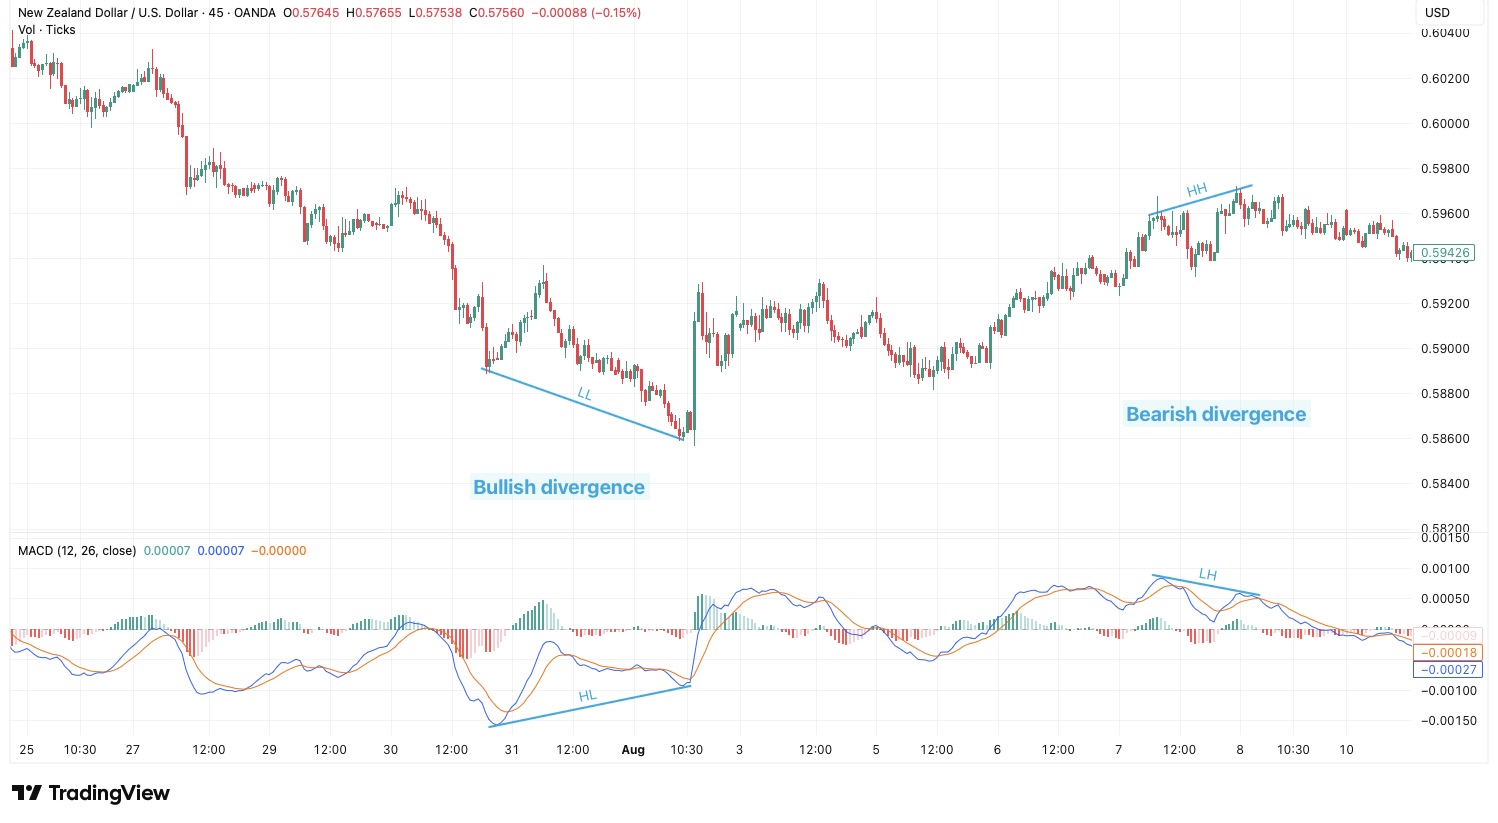
Divergence occurs when price and MACD move in opposite directions → this signals weakening momentum and potential reversals.
Main types (focus on regular for reversals):
Regular Divergence (reversal signal)
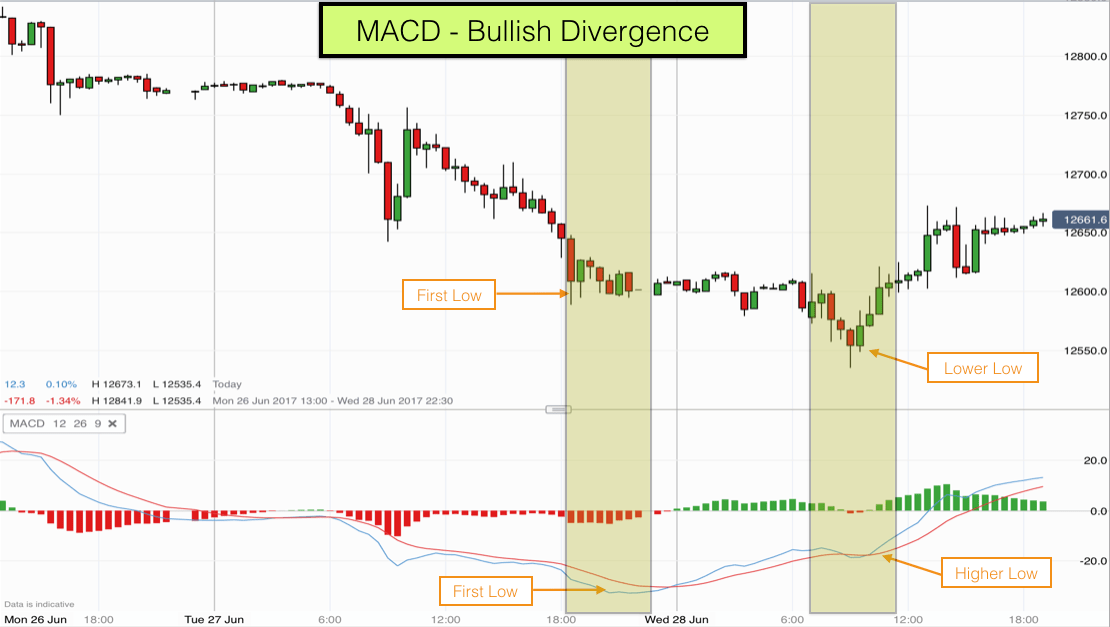
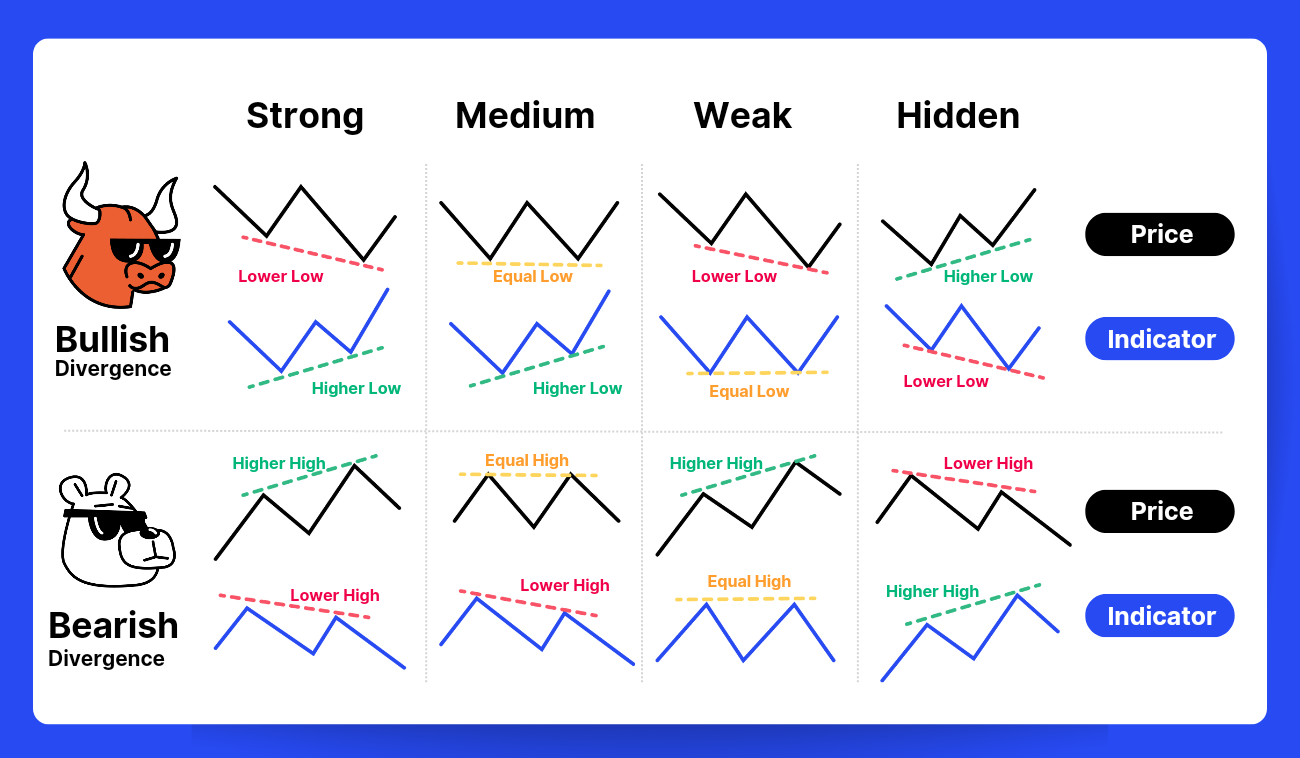
- Bullish: Price makes lower low → MACD line/histogram makes higher low
- Bearish: Price makes higher high → MACD line/histogram makes lower high
Hidden Divergence (continuation signal – use sparingly)
- Bullish hidden: Price higher low → MACD lower low
- Bearish hidden: Price lower high → MACD higher high
Look primarily at the MACD line or shrinking histogram bars for clearest signals.
Core Idea for Confirmation
Pair MACD divergence with the 9–15 EMA strategy for stronger entries:
- Bullish MACD divergence on pullbacks confirms long setups in uptrends
- Bearish MACD divergence on rallies confirms short setups in downtrends
Divergence works best when histogram is extended (far from zero line) and then shows weakening.
Always wait for price action confirmation — never trade divergence alone.
Bullish Divergence Confirmation
Higher Timeframe Bias (4H)
- Price making lower lows
- MACD line or histogram forming higher lows
- Histogram deeply negative (oversold territory)
- Ideally near key support level
Trend Confirmation (1H)
- 9 EMA still above 15 EMA (or preparing to hold)
- Price respecting 9–15 EMA zone as support
- Bullish MACD divergence clear + histogram bars shrinking in negative territory
Entry Setup (15m or 1H)
- Price pulls back into 9–15 EMA zone
- Wait for bullish candlestick (engulfing, pinbar) or close above recent swing high
- MACD line crosses above signal line OR histogram turns positive
- Enter long on confirmation candle close
SL/TP
- SL: Below recent swing low or on close below 15 EMA
- TP: Minimum 1:2 RR | trail SL below new swing lows
Bearish Divergence Confirmation
Higher Timeframe Bias (4H)
- Price making higher highs
- MACD line or histogram forming lower highs
- Histogram deeply positive (overbought territory)
- Ideally near key resistance level
Trend Confirmation (1H)
- 9 EMA still below 15 EMA
- Price respecting 9–15 EMA zone as resistance
- Bearish MACD divergence clear + histogram bars shrinking in positive territory
Entry Setup (15m or 1H)
- Price rallies into 9–15 EMA zone
- Wait for bearish candlestick or close below recent swing low
- MACD line crosses below signal line OR histogram turns negative
- Enter short on confirmation candle close
SL/TP
- SL: Above recent swing high or on close above 15 EMA
- TP: Minimum 1:2 RR | trail SL above new swing highs
Conditions to Avoid
- No clear swing highs/lows for drawing divergence lines
- Divergence during very strong trending moves (momentum can stay extended)
- Multiple weak or tiny divergences without EMA alignment
- Sideways/choppy markets with frequent false signals
- Low-volume periods or around major news events
Additional Tips
- Works excellently on BTC, ETH, and major altcoins
- Use 1H–4H for spotting divergence (lower timeframes are noisy)
- Combine with 9–15 EMA trend bias and RSI for triple confirmation
- Histogram shrinking toward zero often gives earliest warning
- Risk 1–2% per trade and always backtest on your pairs
MACD divergence adds powerful momentum confirmation to the 9–15 EMA strategy — it helps spot fading trends early and improves timing on high-probability crypto trades.