Technical Analysisby Akhil Gaddam
Technical Analysis for Crypto Traders: Mastering Chart Patterns
3 min read14 January 202632 reads
Written by

1 follower
Technical analysis is a critical skill for cryptocurrency traders looking to make informed trading decisions. By understanding chart patterns, indicators, and market psychology, traders can better identify entry and exit points, manage risk, and improve their overall trading performance.
Understanding Chart Patterns
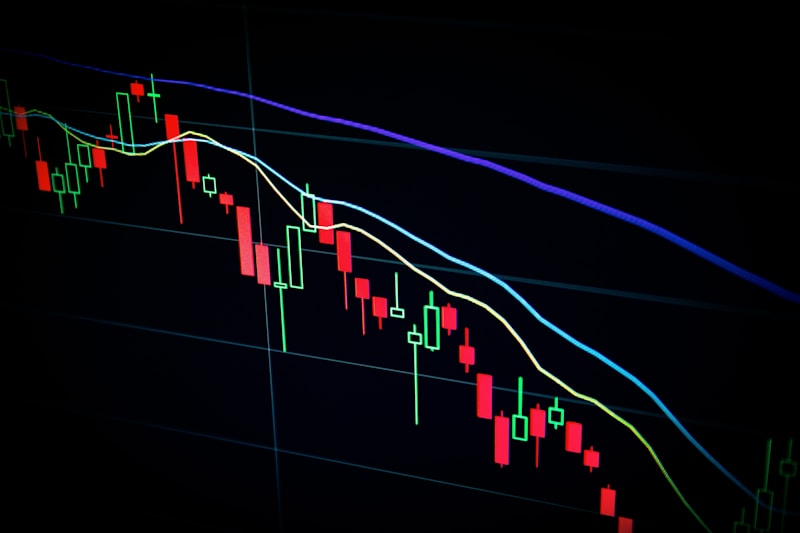
Chart patterns are visual formations that appear on price charts and can signal potential market movements. Head and shoulders patterns often indicate trend reversals, while triangles suggest consolidation before a breakout. Double tops and bottoms help identify support and resistance levels where price reversals are likely to occur. Learning to recognize these patterns gives traders an edge in predicting future price action.
Essential Technical Indicators

Moving averages smooth out price data to identify trends more clearly. The 50-day and 200-day moving averages are particularly important for identifying long-term trends. When the 50-day crosses above the 200-day, it forms a golden cross, a bullish signal. The Relative Strength Index (RSI) measures momentum and helps identify overbought or oversold conditions. RSI values above 70 suggest overbought conditions, while values below 30 indicate oversold conditions.
MACD (Moving Average Convergence Divergence) helps traders spot trend changes and momentum shifts. Bollinger Bands measure volatility and provide dynamic support and resistance levels. When price touches the upper band, it may indicate overbought conditions, while touches to the lower band suggest oversold conditions.
Support and Resistance Levels
Support levels are price points where buying pressure overcomes selling pressure, preventing further declines. Resistance levels are where selling pressure overcomes buying, preventing further advances. These levels are crucial for setting stop-losses and take-profit targets. Multiple touches of a level strengthen its significance, making it more reliable for trading decisions.
Volume Analysis
Volume confirms price movements and helps validate breakouts. High volume during an uptrend confirms bullish momentum, while high volume during a downtrend confirms bearish pressure. Low volume during price movements may indicate weak conviction and potential reversals. Always combine volume analysis with price action for better accuracy.
Risk Management
Successful trading requires strict risk management. Never risk more than 1-2% of your capital on a single trade. Use stop-loss orders to limit potential losses and protect your capital. Set realistic profit targets based on technical levels rather than emotions. Keep a trading journal to track your decisions and learn from both wins and losses.
Conclusion
Mastering technical analysis takes time and practice, but it provides traders with valuable tools for navigating cryptocurrency markets. Combine multiple indicators and patterns for confirmation rather than relying on a single signal. Stay disciplined, manage your risk, and continuously educate yourself to improve your trading skills over time.
To integrate technical analysis into your daily trading strategy:
1. Start your trading day by checking multiple timeframes (daily, 4-hour, 1-hour) to understand the broader trend context.
2. Identify key support and resistance levels on your charts and mark them clearly. These will serve as potential entry and exit points.
3. Use a combination of indicators rather than relying on just one. For example, confirm a trend identified by moving averages with RSI and volume analysis.
4. Set up price alerts at critical levels so you can react quickly when opportunities arise without constantly monitoring charts.
5. Keep a trading journal documenting which patterns and indicators worked in different market conditions. This helps you refine your strategy over time.
6. Practice on paper trading or with small positions before committing significant capital to test your technical analysis skills.
Remember that technical analysis is not about predicting the future with certainty, but about identifying high-probability setups and managing risk effectively. By consistently applying these tools and continuously learning from both successes and failures, you can develop a robust trading strategy that adapts to changing market conditions.