Technical Analysisby Akhil Gaddam
RSI Divergence Patterns: Identifying Reversal Signals in Crypto Markets
2 min read24 February 202628 reads
Written by

1 follower
RSI (Relative Strength Index) divergence is one of the most powerful technical analysis tools for identifying trend reversals in cryptocurrency markets. When price makes a new high or low but the RSI fails to confirm this movement, a divergence signals that the current trend is weakening and a reversal may be imminent.
Understanding Bullish Divergence
A bullish divergence occurs during a downtrend when price reaches a lower low while RSI reaches a higher low. This indicates that although price is declining, momentum is strengthening. Traders interpret this as a potential reversal signal where the downtrend may be exhausted and an uptrend could begin. This is particularly effective when RSI bounces above the 30 overbold level.
Recognizing Bearish Divergence
Bearish divergences occur in uptrends when price makes a higher high while RSI makes a lower high. This shows weakening momentum despite prices rising, suggesting the uptrend is losing steam. When RSI fails to break above previous resistance levels alongside higher prices, a bearish divergence signals potential downside ahead. Traders watch for RSI below the 70 overbought level.
Timing Your Entry Points
The key to using RSI divergence effectively is timing. Don't enter trades immediately upon spotting a divergence. Wait for confirmation through price action, such as a break below a trendline in bearish divergences or a break above resistance in bullish divergences. Many successful traders combine RSI divergence with other indicators like moving averages or support/resistance levels.
Real-World Trading Examples
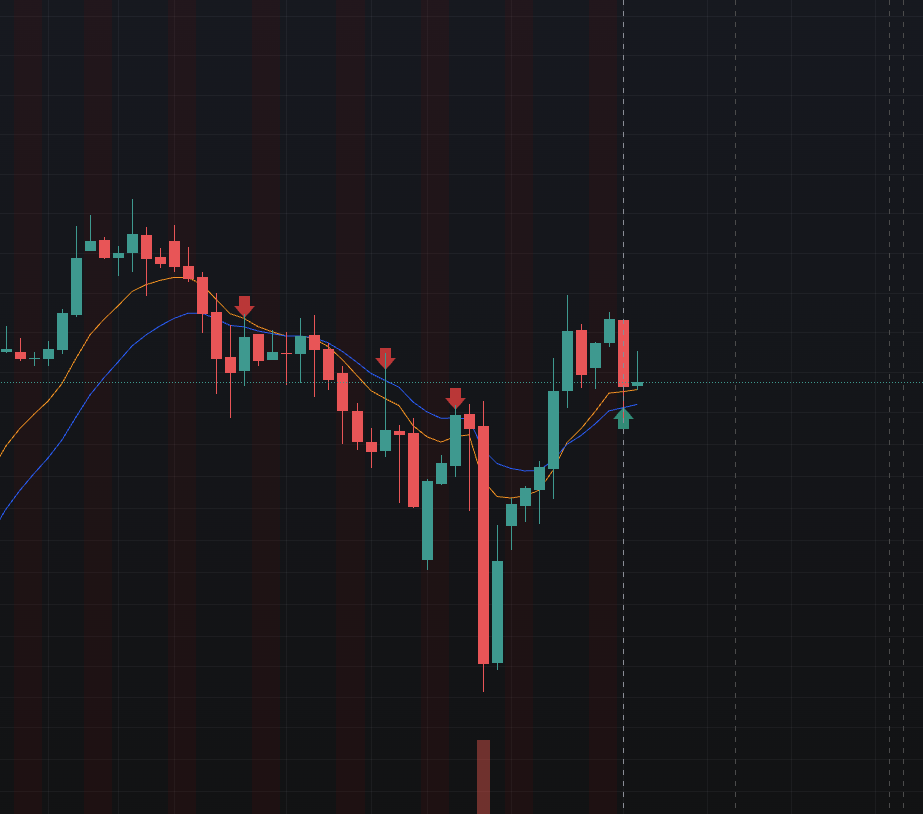
In Bitcoin's recent movements, traders have successfully identified reversal points using RSI divergence combined with 4-hour and daily timeframe analysis. When Bitcoin reached new lows but RSI showed strengthening momentum, subsequent rallies of 15-25% often followed within days.
Common Mistakes to Avoid
Don't rely solely on RSI divergence. False divergences are common, especially in choppy, ranging markets. Always wait for confirmation from other technical indicators. Additionally, divergences on shorter timeframes (5-minute, 15-minute) are less reliable than those on hourly and daily charts.
Start using RSI divergence combined with price action confirmation for more profitable crypto trades.