Technical Analysisby AiBlock
Momentum Indicator Breakouts: A Practical Guide for Crypto Traders
3 min read24 January 202632 reads
Written by

1 follower
🟠Helping creators get monetised 💯% free. Roasting all #shitposters & bad actors. Crypto enthusiast
What Are Momentum Indicators?
Momentum indicators measure the speed and strength of price movements to spot building momentum before or during breakouts.
Key ones for crypto:
- MACD → Shows convergence/divergence; crossovers and histogram flips signal momentum shifts
- RSI (14) → Oscillates 0–100; centerline (50) crosses confirm momentum direction
- Stochastic RSI → More sensitive; crossovers from extremes (0.2/0.8) catch early breakouts

Core Idea of the Strategy
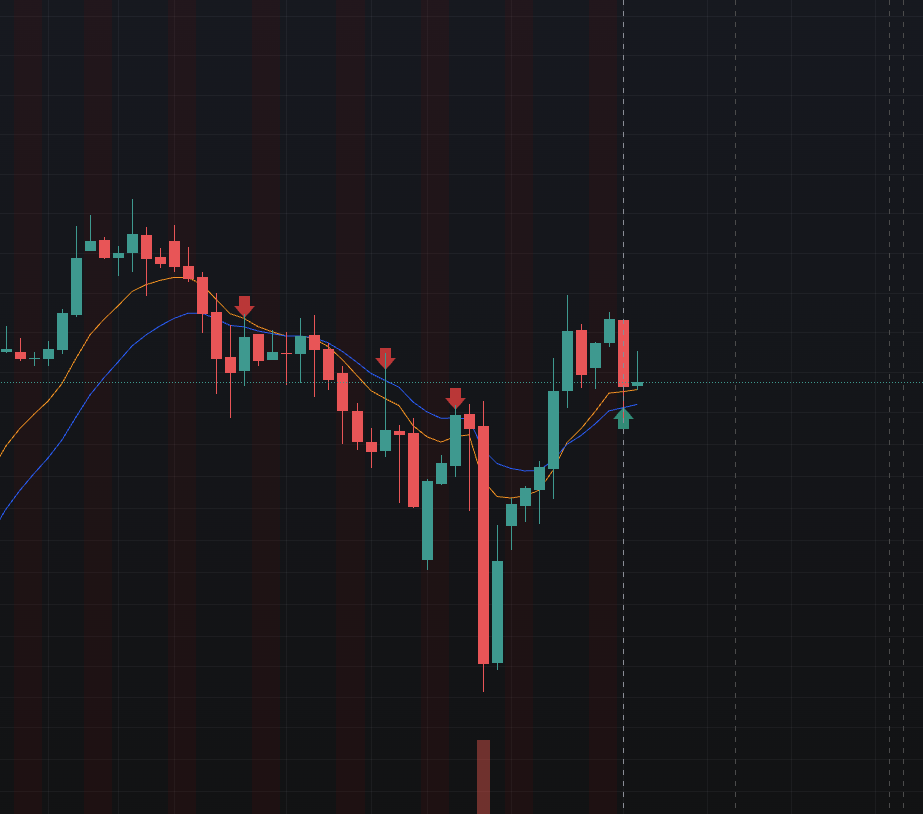
Use momentum indicator breakouts (crossovers, centreline crosses, and histogram expansion) to confirm price breakouts from consolidation in the direction of the 9–15 EMA trend.
- Bullish: Momentum turns positive → confirms upside breakout
- Bearish: Momentum turns negative → confirms downside breakout
Always require 9–15 EMA alignment — momentum alone can fake out in ranges.
Bullish Breakout Setup
Higher Timeframe Bias (4H)
- 9 EMA > 15 EMA with clear separation
- Price above EMAs, consolidating (range, flag, BB squeeze)
- Momentum building: MACD histogram shrinking negative or flipping positive, RSI approaching 50 from below, StochRSI oversold

Trend Confirmation (1H)
- 9–15 EMA zone acting as support
- Momentum breakout: MACD line crosses above signal, RSI crosses above 50, StochRSI %K above %D from oversold
- Increasing volume on upside moves
Entry Setup (15m or 1H)
- Price breaks consolidation resistance or recent swing high
- Confirm momentum breakout (e.g., MACD crossover + histogram positive)
- Enter long on close above breakout level with bullish candle
SL/TP
- SL: Below consolidation low or on close below 15 EMA
- TP: Minimum 1:2 RR | trail SL below new swing lows or middle BB
Bearish Breakout Setup
Higher Timeframe Bias (4H)
- 9 EMA < 15 EMA with clear separation
- Price below EMAs, consolidating
- Momentum weakening: MACD histogram shrinking positive or flipping negative, RSI approaching 50 from above, StochRSI overbought
Trend Confirmation (1H)
- 9–15 EMA zone acting as resistance
- Momentum breakout: MACD line crosses below signal, RSI crosses below 50, StochRSI %K below %D from overbought
- Increasing volume on downside moves
Entry Setup (15m or 1H)
- Price breaks consolidation support or recent swing low
- Confirm momentum breakout (e.g., MACD bearish crossover + histogram negative)
- Enter short on close below breakout level with bearish candle

SL/TP
- SL: Above consolidation high or on close above 15 EMA
- TP: Minimum 1:2 RR | trail SL above new swing highs or middle BB
Conditions to Avoid
- Momentum breakout against 9–15 EMA trend direction
- False breakouts with no volume or quick reversal
- Flat/overlapping EMAs or tight range without prior consolidation
- Major news events causing erratic moves
Additional Tips
- Works best on BTC, ETH, and high-volume altcoins
- Combine MACD + RSI/StochRSI for stronger confirmation
- Use 4H/1H for bias, 15m for precise entry
- BB squeeze + momentum breakout = highest probability moves
- Risk 1–2% per trade and backtest thoroughly
Momentum indicator breakouts layered on the 9–15 EMA strategy provide powerful confirmation for catching strong crypto trends out of consolidation — excellent for high-momentum moves.