Bitcoinby Akhil Gaddam
February 2026 Crypto Market Analysis: Breaking Through Resistance and Key Opportunities Ahead
1 min read24 February 202627 reads

Written by

1 follower
The cryptocurrency market continues to demonstrate resilience and growth momentum as we enter the second month of 2026. With Bitcoin holding strong above key resistance levels and altcoins showing renewed interest, this is an opportune moment to analyze the current market structure and identify potential trading opportunities.
Current Market Structure
Bitcoin has maintained its position above the $50,000 mark, establishing a new support zone that suggests institutional confidence in the asset. The rejection of lower price levels indicates strong buyer interest at these price points, a bullish signal for long-term holders and traders alike. Ethereum continues to track Bitcoin's movements while establishing its own technical patterns, with DeFi protocols seeing increased transaction volumes.
The broader market has shifted from the volatility of late 2025 to a more consolidative phase, where price discovery is happening in real-time. Volume profiles reveal significant interest at current levels, with large accumulation blocks visible on the 4-hour and daily timeframes.
Technical Analysis Highlights
Altcoin Market Dynamics
Ethereum's relative strength against Bitcoin has improved significantly, with altcoins entering a rotation phase. Projects in the DeFi, Layer-2, and infrastructure spaces are attracting capital inflows. The ratio trading opportunity between Bitcoin and altcoins presents an interesting scenario for portfolio rebalancing.
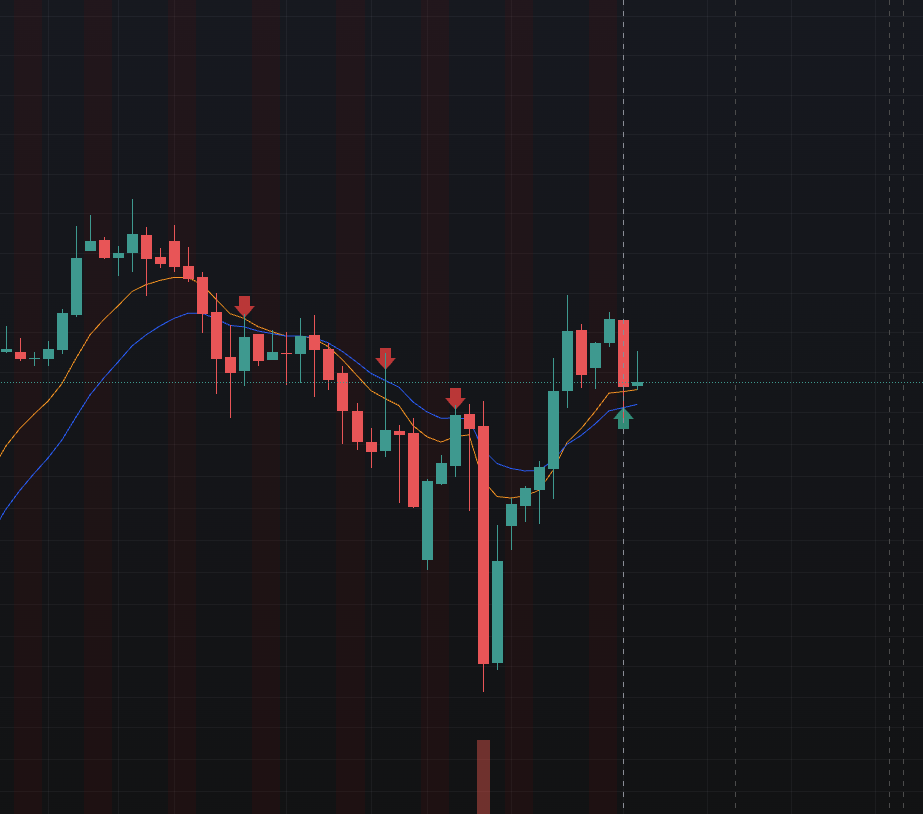
Looking at the weekly chart, we're seeing the formation of what appears to be a Higher High and Higher Low pattern, a classic bullish continuation signal. The 200-week moving average remains sloped upward, confirming the long-term uptrend is intact. RSI oscillators show moderation without reaching overbought conditions, suggesting room for further appreciation without immediate pullback risks.
Key resistance zones exist at the previous all-time high levels, while support is firmly established at the $45,000 to $48,000 range. Breaking through these resistance levels could trigger a rally toward $65,000 to $75,000, a move that would validate the current bullish structure.