Articleby ABHISHEK RAO
Riding the Crypto Waves: The Ultimate Guide to Swing Trading
5 min read8 January 202637 reads
Riding the Crypto Waves: The Ultimate Guide to Swing Trading
As we step into 2026, the cryptocurrency market continues its rollercoaster ride, fueled by institutional adoption, regulatory clarity in major economies, and innovative blockchain developments. Bitcoin has stabilized above key psychological levels, Ethereum's upgrades are enhancing scalability, and altcoins are showing explosive potential. In this volatile environment, swing trading stands out as one of the most effective strategies for retail traders to capture substantial profits without the burnout of day trading or the patience required for long-term holding.

Swing trading bridges the gap between short-term speculation and long-term investment. It involves holding positions for several days to weeks, aiming to profit from price "swings" driven by market momentum, news catalysts, or technical reversals. Unlike scalping, which demands constant screen time, swing trading allows you to analyze charts in the evenings or weekends, making it ideal for those with full-time jobs. In crypto's 24/7 markets, this strategy exploits the frequent overreactions to news, FOMO rallies, and fear-driven dumps.
Understanding the Core of Swing Trading
At its heart, swing trading is about identifying medium-term trends and corrections. Prices rarely move in straight lines; they oscillate in waves. Bullish swings push highs higher, while bearish swings create lower lows. Successful swing traders buy near swing lows (support) and sell near swing highs (resistance), often targeting 10-30% gains per trade.
In 2026, factors like spot ETF inflows, potential rate cuts, and layer-2 ecosystem growth create perfect swing opportunities. For instance, Bitcoin often experiences 20-40% pullbacks in bull markets before resuming uptrends—prime swing setups.


Essential Technical Tools for Crypto Swing Traders
Technical analysis is the foundation. Here are the must-have indicators:
Moving Averages (MA): The 50-day and 200-day EMAs are gold standards. A "golden cross" (50 EMA crossing above 200 EMA) signals bullish swings, while a "death cross" indicates bearish ones. Use the 20-day EMA for shorter swings.
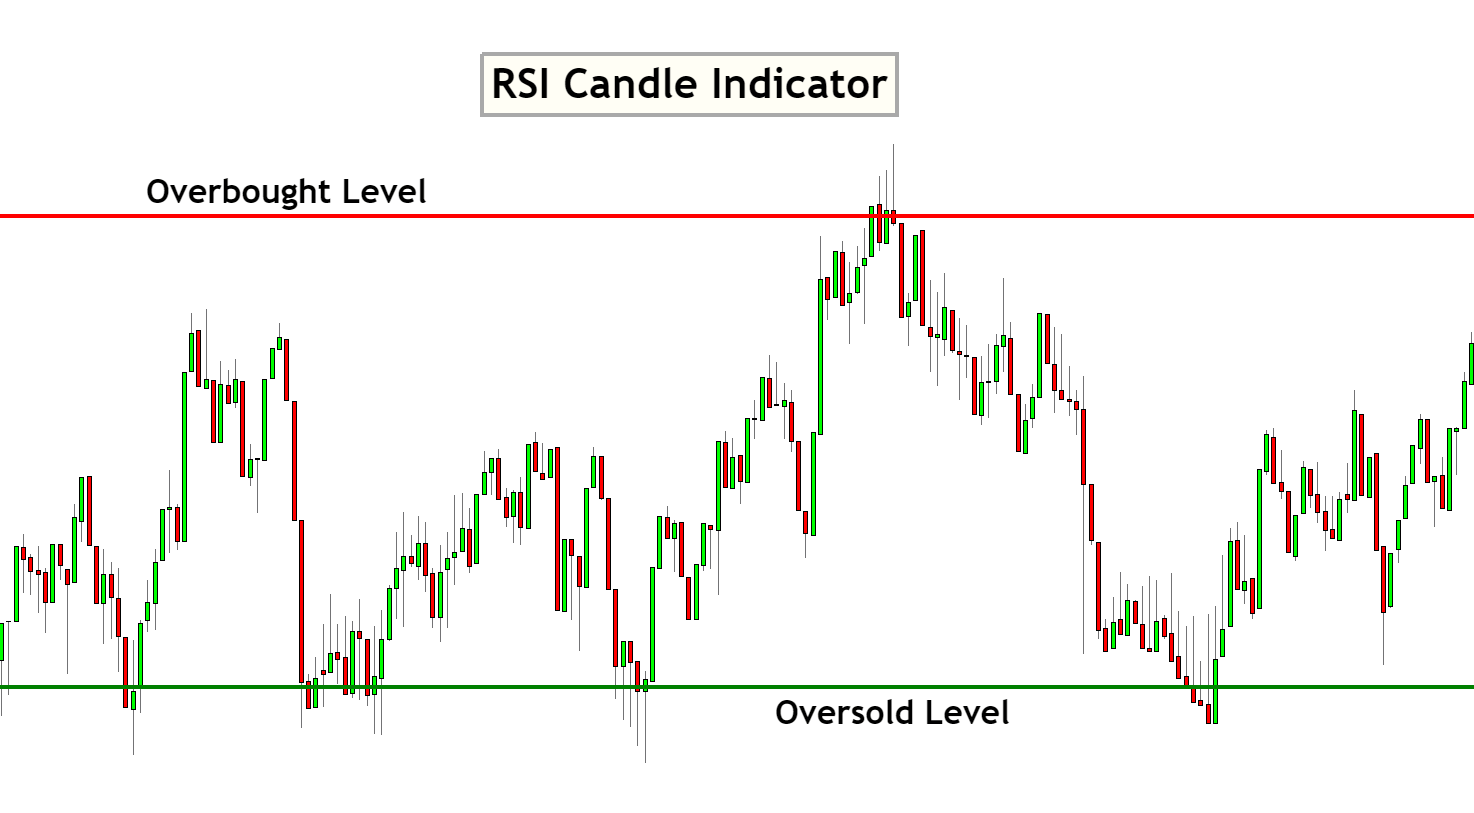
Relative Strength Index (RSI): This momentum oscillator (14-period default) identifies overbought (>70) and oversold (<30) conditions. In uptrends, buy RSI dips to 40-50; in downtrends, sell rallies above 60. Divergences (price highs with lower RSI highs) often precede reversals.

MACD (Moving Average Convergence Divergence): Comprising the MACD line, signal line, and histogram, it spots momentum shifts. Bullish crossovers (MACD above signal) with expanding histogram confirm swing entries. Zero-line crossovers indicate trend changes.


Fibonacci Retracement and Extension: Draw from recent swing high to low (or vice versa). Common retracement levels (38.2%, 50%, 61.8%) act as support in uptrends. Extensions (127.2%, 161.8%) provide profit targets.
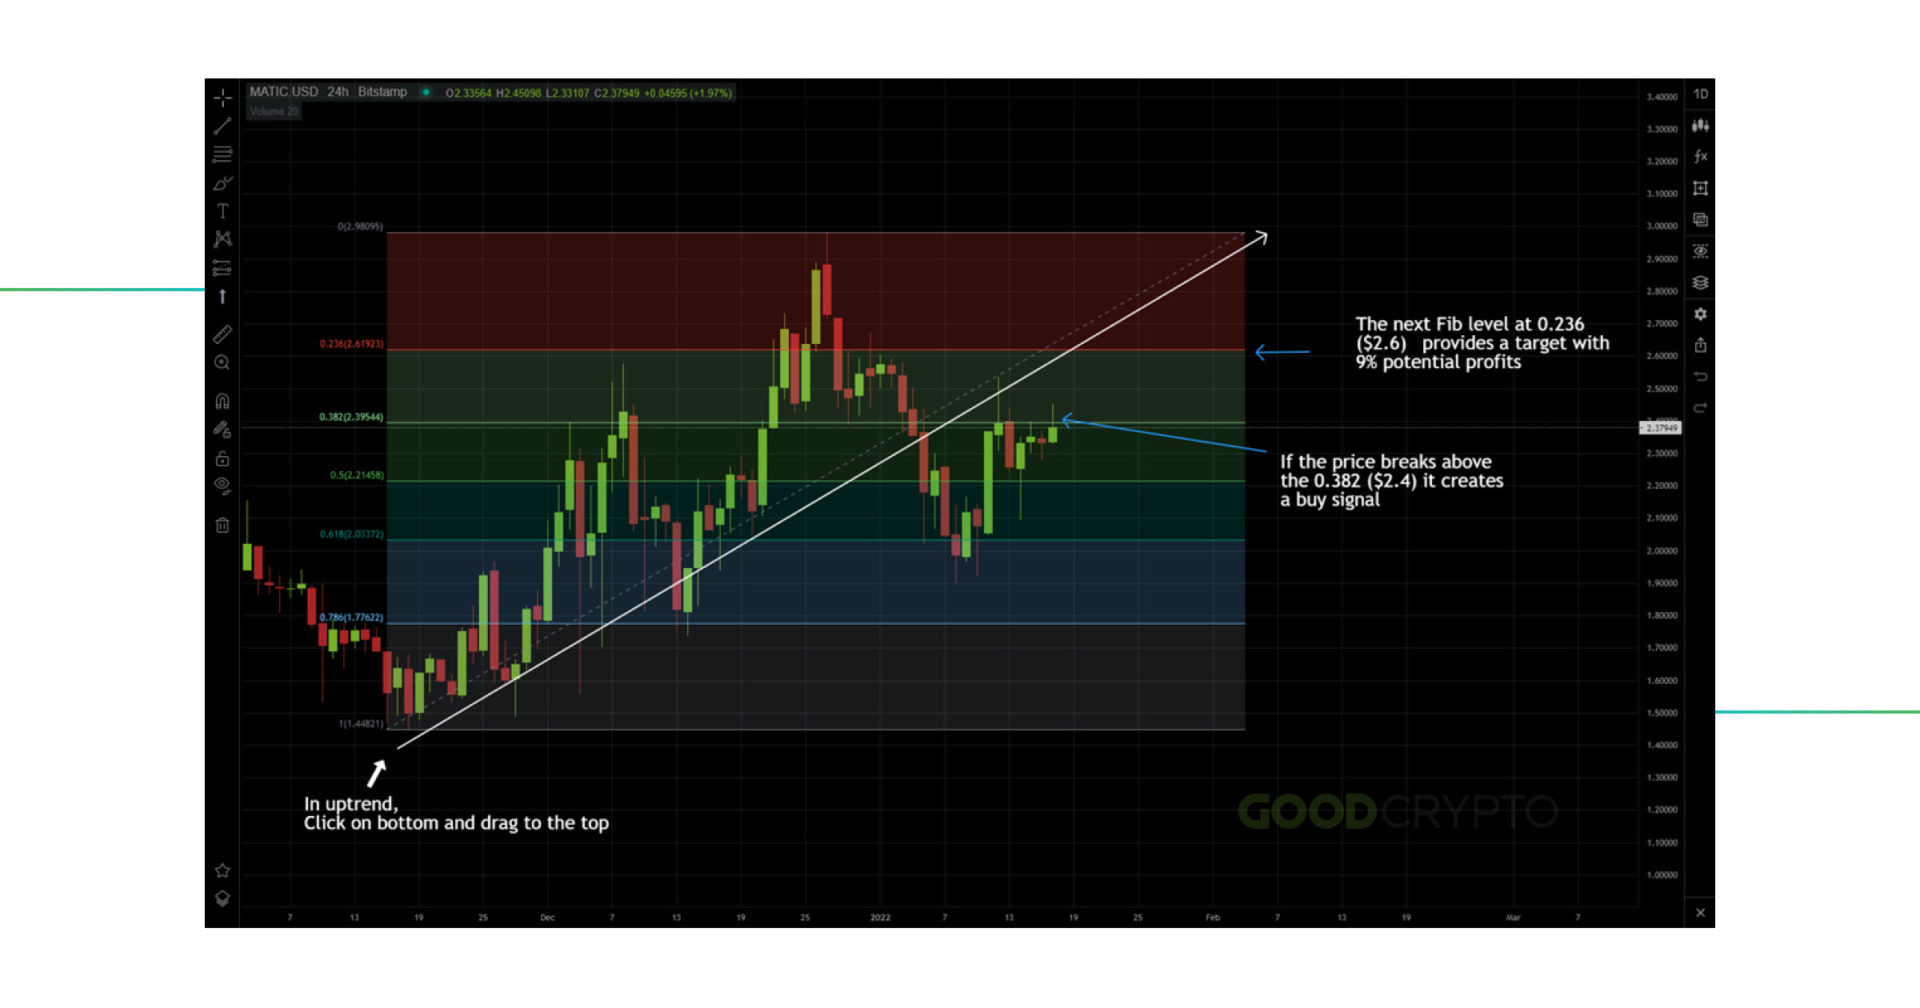
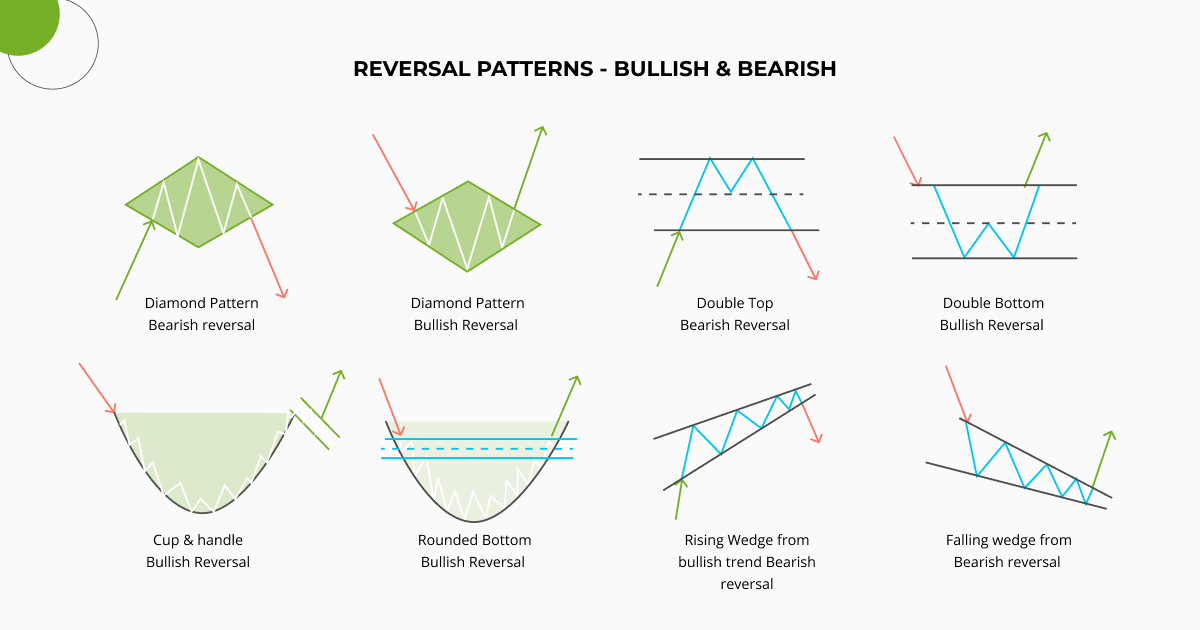
Chart Patterns: Recognize classics like double bottoms/tops, head and shoulders, flags, and triangles. Bullish patterns (ascending triangles, cup-and-handle) signal breakout swings; bearish ones (descending triangles) warn of downsides.
Combine these on higher timeframes (4H, daily) for reliability, and lower (1H) for precise entries.
Step-by-Step Swing Trading Strategy
Trend Determination: Only trade with the dominant trend on daily/weekly charts. Use MA alignment or higher highs/lows.
Setup Identification: Wait for pullbacks in uptrends or rallies in downtrends. Look for confluence: e.g., price at 61.8% Fib, RSI oversold, bullish candlestick (hammer, engulfing).
Entry: Enter on confirmation (close above resistance or MA bounce). For longs: buy the dip; for shorts: sell the rip.
Risk Management: Crucial! Risk no more than 1% of capital per trade. Set stop-loss below recent swing low (or above high for shorts). Aim for 2:1 or 3:1 risk-reward ratio.
Exit: Take profits at resistance/Fib extensions or trailing stops (e.g., below 20 EMA). Partial profits at 50% target preserve gains.
Example: In a BTC uptrend, price pulls back to $80,000 (50% Fib + 50 EMA support), RSI hits 35. Enter long, stop at $75,000 (risk 5%), target $100,000 (reward 25%).
Advanced Tips for 2026
Incorporate on-chain data: Watch exchange inflows/outflows, whale activity via tools like Glassnode.
Monitor fundamentals: ETF flows, halving cycles, protocol upgrades.
Avoid overtrading: 3-5 quality setups per month suffice.
Backtest: Use historical data on TradingView to refine.
Psychology: Journal trades, stick to plans—emotions kill swings.
Swing trading demands patience and discipline, but rewards those who master it with consistent returns in crypto's wild seas. Start small, scale with confidence.