cryptoby Debashis Jana
How to Trade Crypto Reversals Using Candlestick Highs and Lows
2 min read16 January 202643 reads
Written by

How To Use Candlestick Highs and Lows to Trade Reversals in Crypto
Candlestick highs and lows are some of the most powerful yet underrated tools for spotting potential reversals in the crypto market. Because crypto trades 24/7 and is highly driven by emotion, price extremes often reveal where buyers or sellers are losing control. Learning to read these levels correctly can significantly improve your timing and risk management.
Understanding Candlestick Highs and Lows
Each candlestick shows four key prices: open, close, high, and low. The high represents the highest price reached during that period, while the low shows the lowest. These extremes mark areas where price was rejected, often signaling strong supply (at highs) or demand (at lows).
When price repeatedly fails to break above a previous high, it suggests sellers are defending that level. Likewise, repeated rejection from a low indicates buyers stepping in. These reactions form the foundation for reversal trading.
Identifying Potential Reversal Zones
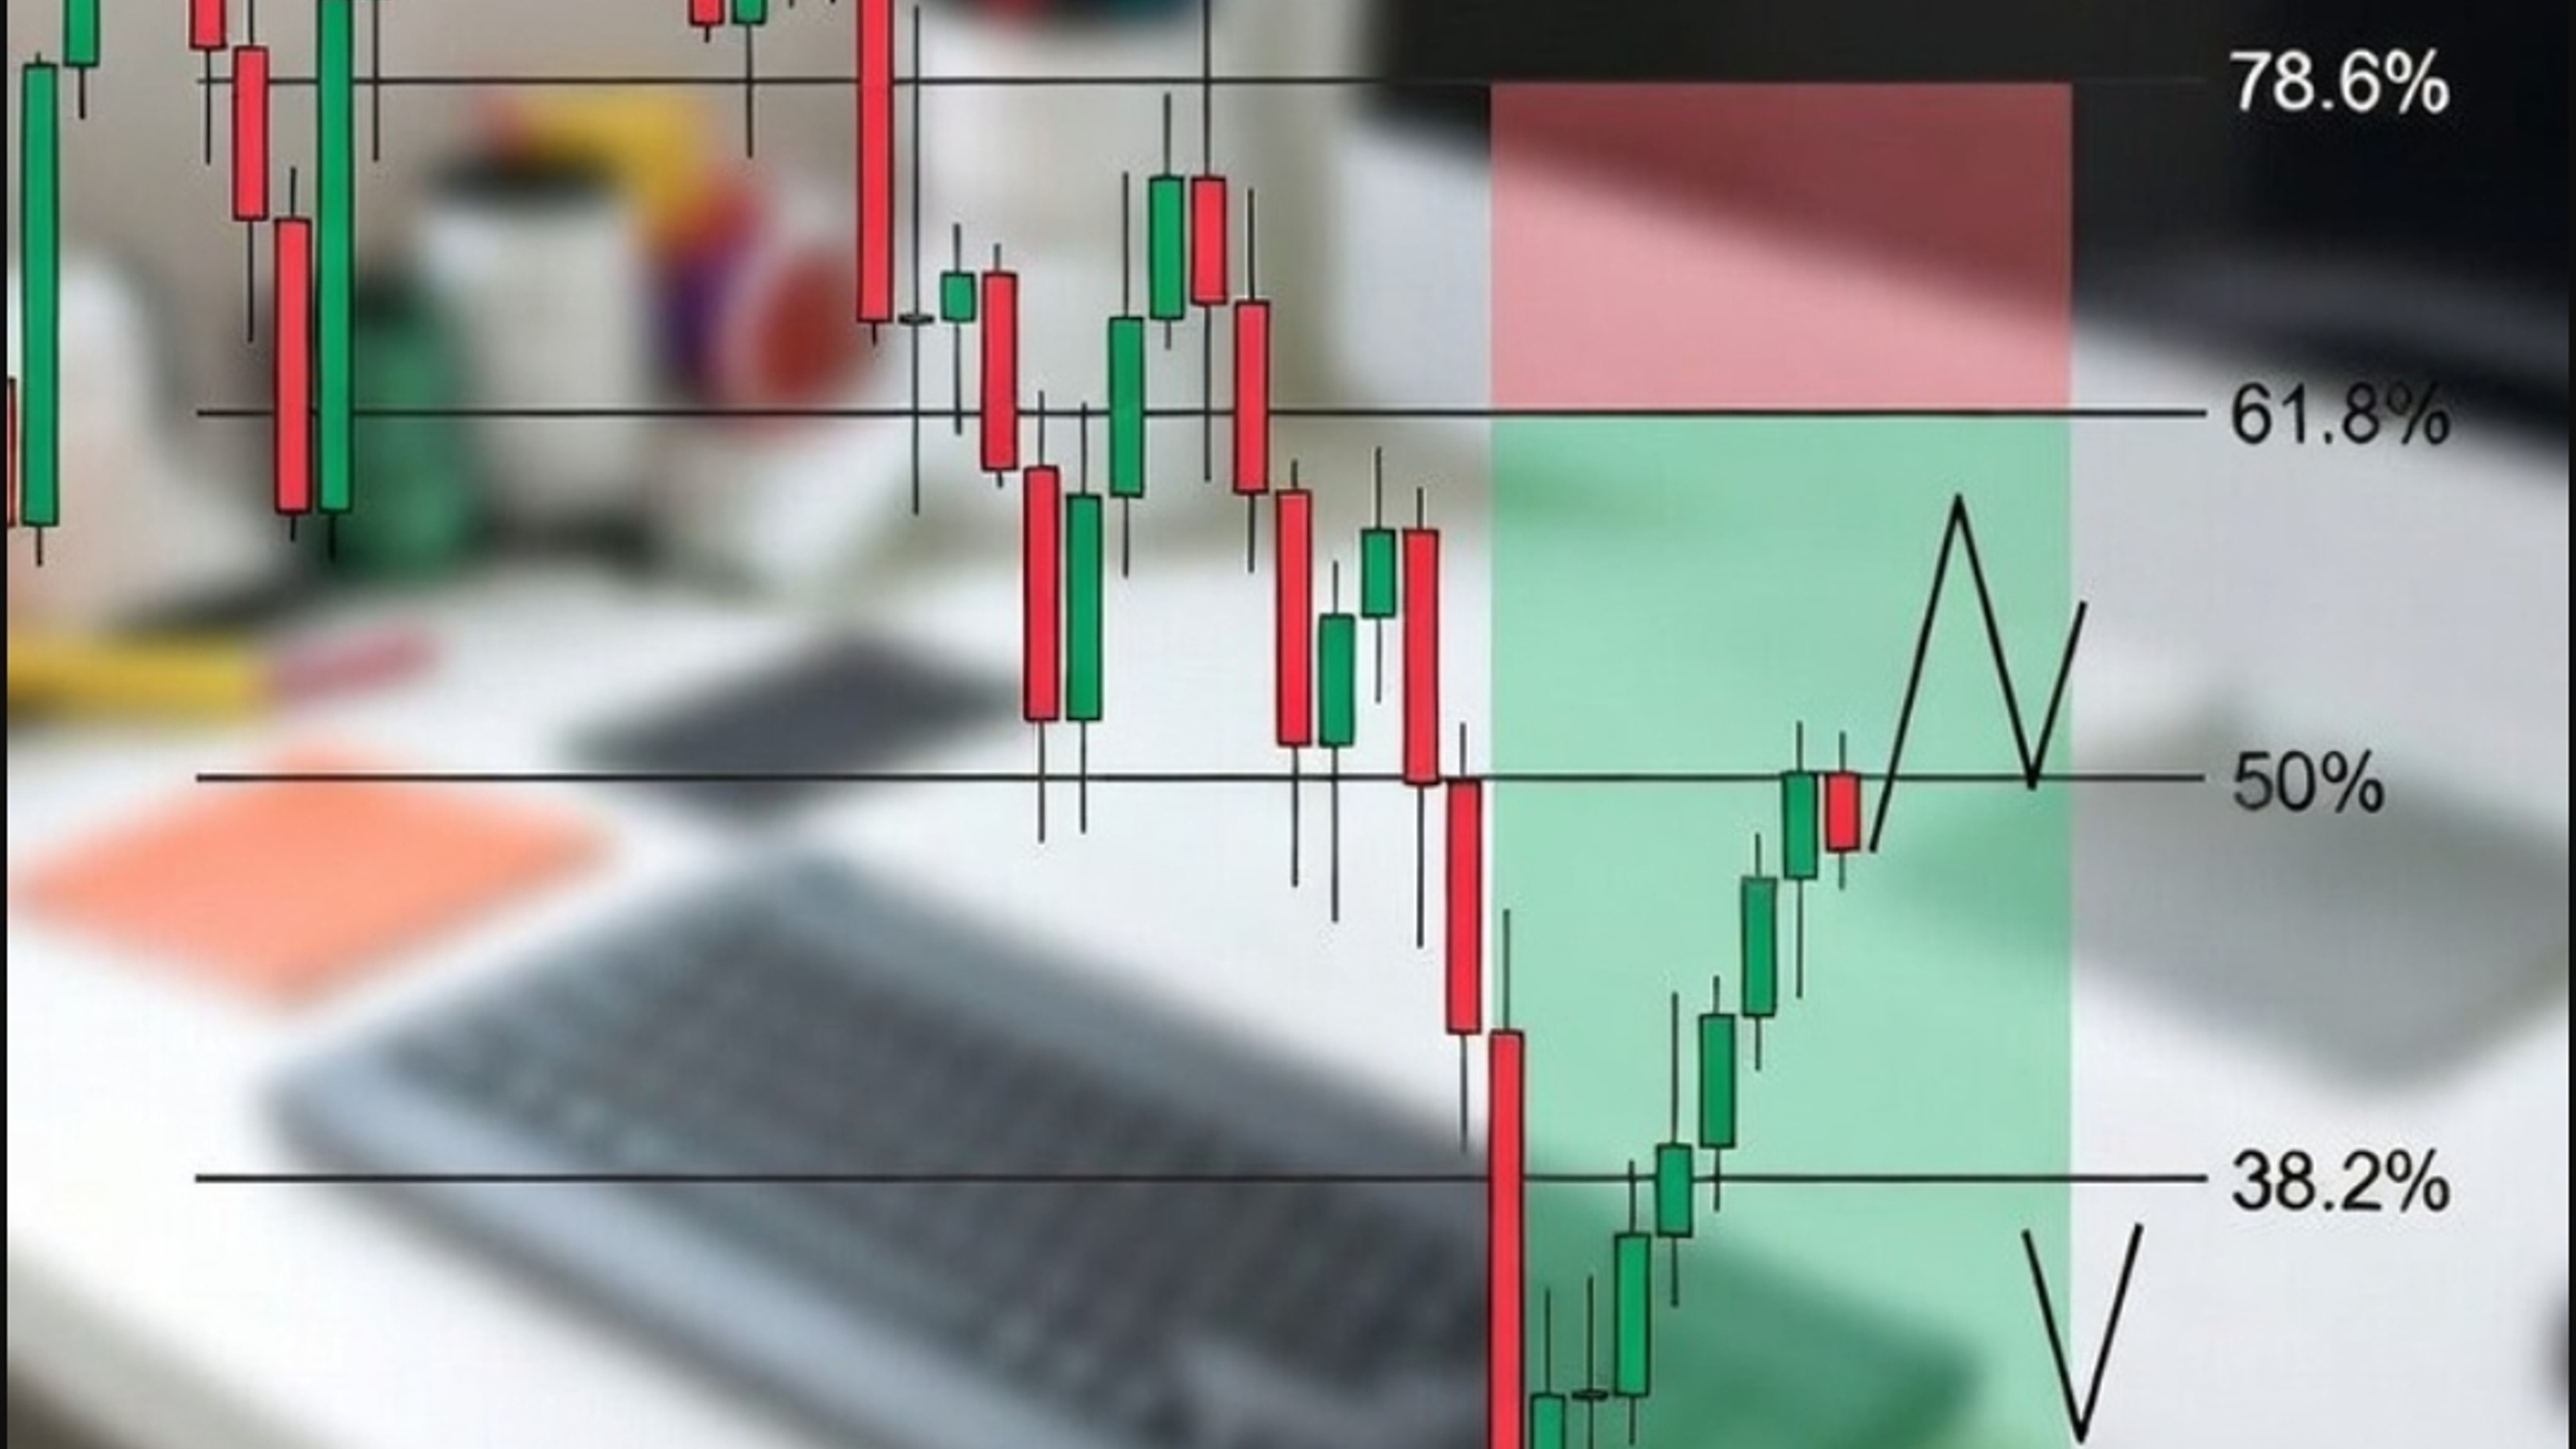
Instead of focusing on a single candle, look for clusters of highs or lows. Multiple candles with similar highs can form a resistance zone, while multiple similar lows create support. In crypto, these zones are especially important on higher timeframes like the 4H, daily, or weekly charts.
A potential reversal becomes more likely when price approaches a prior high or low after an extended move. For example, if Bitcoin rallies aggressively into a previous swing high and starts printing smaller candles or long upper wicks, it often signals buyer exhaustion.
Candlestick Signals at Highs and Lows
Reversals are strongest when highs or lows align with clear candlestick patterns. Watch for:
Long wicks rejecting a level
Engulfing candles at support or resistance
Pin bars showing sharp rejection
Doji candles signaling indecision after a strong trend
These patterns suggest that the side in control is weakening, increasing the probability of a reversal.
Trade Execution and Risk Management
When trading reversals, patience is key. Wait for confirmation — not just price touching a high or low, but clear rejection. Entries are often safer after the candle closes, not during formation.
Place stop losses slightly beyond the high or low being traded to protect against false breakouts, which are common in crypto. Targets can be set at the next major support or resistance level, ensuring a favorable risk-to-reward ratio.
Final Thoughts
Candlestick highs and lows help traders read market psychology in real time. When combined with structure, confirmation, and disciplined risk management, they become a reliable framework for trading crypto reversals — even in volatile conditions.